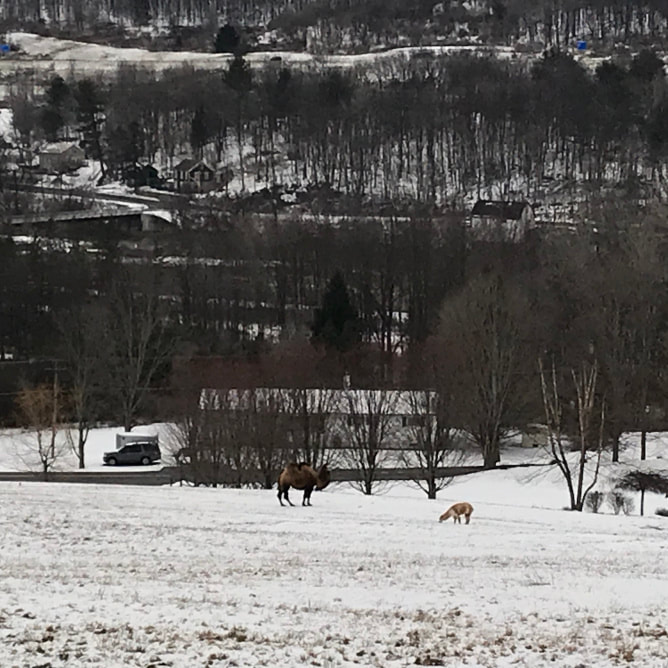
 a camel in central New York The next 9 blog posts will summarize my reading assignments for the EBIO 3rd semester exam. The exam is scheduled for 3 hours and involves my four committee members asking me questions about anything at all! I was required to put together a reading list covering 4 main topics: biological soil crusts & drylands, microbial ecology, ecosystem services, and community, restoration, and disturbance-succession ecology. Obviously, I actually have 7 topics, which I managed to squeeze into "4". The reading list is a guide for the exam. To help me through this exam preparation process, I will use these blogs to summarize what I am learning over the next 9 weeks.
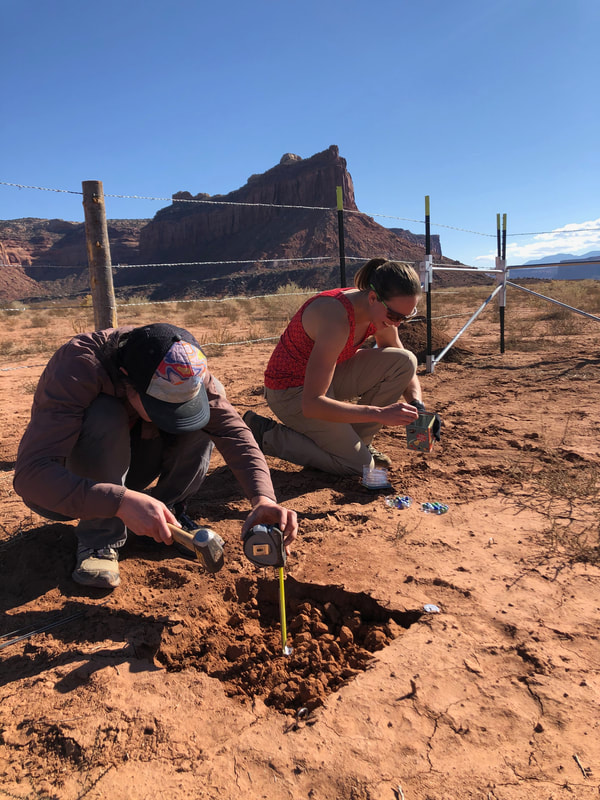
What are we building toward? With threats to soil (described in previous blog posts) we can expect human populations to become more vulnerable to food insecurity, water insecurity, and health risks due to erosion and climate change. A goal of applied soil microbiology might be to monitor soil quality in vulnerable regions and have early warning systems in place that would alert local authorities to soil needs for continued delivery of services. Some functions may decline slowly over time depending on the soil type, climate, and land use, but some may occur quickly as thresholds are reached. The goal would be to correct human use or apply rehabilitation strategies in ethical, consistent, and appropriate ways around the world in response to the multitude of pressures that continue to be placed on Earth's Critical Zone. In this way, we may be able to prolong different regions' self sufficiency to produce food for people and clean water. In order to reach such a lofty goal, there is quite a bit of basic science that needs to be done to understand the ecology of soil environments (though much has been done already!). My reading this week delved into dominant soil taxa, how water and drought influence the soil as microbial habitat, and ways to measure soil health. The rest of this blog details these topics. This week, I will move on to two textbooks. One is on soil ecology and ecosystem services and the other is focused on the field of community ecology. There are five main microbial phyla in soils (Actinobacteria, Acidobacteria, Pseudomonads, Bacteroidetes, and Verrumicrobia). One reading this week indicated that there must have been an ancient selective pressure in soil environments where these 5 phyla were selected for globally. When you compare soils to other environments, the diversity (at lower taxonomic levels) is "unparalleled" with thousands to millions of taxa in 10 g of soil. One of the challenges is determining what drives the distribution and diversity of these organisms and how the communities are maintained. At a continental scale, soil pH is a major driver of microbial community composition. This is different from plant and animal communities that are often shaped by precipitation and temperature. At smaller spatial scales (regional to local), important drivers of microbial community composition include precipitation, temperature, location, vegetation types, soil characteristics, elevation, land use, and land management. It is also important to know that there can be large temporal patterns to community composition (wet-dry events or seasonal shifts) as well as significant changes with depth. Resources like water, oxygen, nutrients, pH, and temperature can shift dramatically with soil depth and microbes respond to that. Soil is a complex environment and multiple factors come together to provide a huge number of niches and thus a lot of diversity. The key to this is soil structure ... the fundamental unit is the soil agglomerate. Agglomerates depend on soil type, organic matter, and activity of biota. Agglomerates can be anaerobic on the inside and aerobic on the outside such that many different types of organisms live in a small space, relying on different resources. You can imagine agglomerates of various sizes together with pore spaces between. With wetting events, pore spaces fill with water. As soils dry, the pore spaces empty of water. Water is important to microbes in three different ways. It is a resource, a solvent, and a transport medium. As a resource, water dictates the physiological states of cells and metabolism. As a solvent, water presence means that solutes are available for use. And as a transport medium, water presence means that new resources can come your way. If you are a cell, stuck to a well watered agglomerate, it is still important that you are connected (via water) to other agglomerates with resources. An important measure in soils is water potential. There are 4 components of total water potential (osmotic, matric, gravity, and pressure). Cells have to adjust themselves and their surroundings to be able to survive with these stresses. At -14 Mpa water potential, biologic activities cease. Initially, researchers thought this was due to direct stress on a cell, but the more important limitation is often the lack of nutrient availability (connectivity between cells and resources). As water leaves pore spaces, thin films remain on soil agglomerates through adhesion and capillary forces. These films become too thin for microbes to move or for nutrients to diffuse to cells. Thus biological activity stops. Some organisms have developed adaptations and do better under dry conditions than wet. For instance, fungi grow large hyphae across dry soil pores, connecting to water patches and surviving better than soil fauna or bacteria under dry conditions. Following this idea, one might expect that dry ecosystems would have more fungi, but you actually see lower fungi:bacterial ratios and this is likely driven by plant limitations (which are more tightly responsive to moisture conditions). There is some variation in how each organism responds to drying, but overall, Manzoni et al. (2012) found that there is a consistent decrease in microbial community activity as soil moisture declines across biomes and climatic conditions. Drought was the focus of one reading this week. They discussed four organismal responses to drought: osmotic acclimation, allocating resources to survival instead of growth, enhancing the environment via EPS, and using an altered physiological state (dormancy). At the community level, you might expect that microbial biomass would decrease with drought, but that is not always the case. Seasonally, sometimes biomass is higher during drought periods or with a dry-wet cycle, there can be an immediate biomass decline that later rebounds. Shifts in composition may occur for many reasons (directly or indirectly) related to drought for example through plant phenology, which microbes then respond to. I am learning that microbial community analyses cannot be separated from the plant communities around them, since both influence one another. Again, microbial composition shifts may actually be shifts in activity (you'd have to measure RNA to see it). At the ecosystem level, there were four examples of how moisture can affect biogeochemical cycles. Carbon cycling can be affected by moisture through enzymatic activity and through CO2 pulses with rewetting. The rate limiting step of metabolic pathways is often the depolymerization of large macromolecules in the soil (outside of cells). To get at these resources, microbes excrete degradative enzymes. Both the production of enzymes and the enzyme activity can change with changes in moisture...affecting carbon cycling. Second, as soils are rewet, there is a well-known pulse of CO2 released (called the Birch Effect). People are not sure why this occurs or the sources of the carbon. One guess is that the CO2 is released from microbes (without cell lysis) and is due to the soil agglomerates slaking (breaking open and exposing internal spaces to water). This CO2 pulse is sensitive to the soils' history of drought. Nitrogen cycling can also be affected at the nitrogen mineralization and nitrification steps. Overall, studying dry-rewetting cycles can be challenging because many chemicals are water soluble and you have to extract them. How can you extract water-soluble compounds under drought conditions? The Makhalanyane et al (2015) paper focuses on the soil microbial ecology in hot deserts characterized by minimal and erratic precipitation, extreme temperature fluctuations, low nutrient status, high UV levels, and strong winds. These systems can be different: there are fewer genes for N, K, S metabolism in deserts, nutrient cycling rates are lower, higher # of genes for dormancy and stress response, fewer antibiotic-resistance genes in deserts, competitive interactions might be less important. Factors explaining community assembly in deserts is similar to the list above for soils generally: water availability, nitrogen, salts, pH, temperature. This paper also describes two community types: biological soil crusts (dominated by filamentous cyanobacteria) and hypoliths (dominated by coccoid cyanobacteria). In both cases, the bulk soil is considered a seed bank for the more specialized community. The last two papers were on soil microbe measurements. Prosser et al (2015) describes the use of 'omics' in microbial ecology including the biases, limitations, and future directions. The main idea from this paper is that when possible, you should use metagenomics in a specific way (not a descriptive study). Do not assume spatial/temporal homogeneity. Most importantly, the metagenomic data should be paired with metadata...studies should always be linked to soil functions! Schloter et al. (2018) was on microbial indicators of soil quality. They list five life-support functions of soils: fertile ground for food, biodiversity maintenance, clean water, protection from erosion, and sink for greenhouse gases. Soils are multifunctional and we want to be able to maintain multiple functions simultaneously. Some threats to soil's ability to perform these functions include climate change, land use, mining, pollution, and urbanization. The authors provide examples for three of the five functions listed ... how one could develop a quantitative bioindicator based on the microbial community that would tell you when a function is failing. Their main framework consists of modeling the "normal operating range" for various microbial indicators with thresholds in place. You could then map your soil to these models and determine if the soil was within a normal range or if some intervention needed to be arranged. References Makhalanyane, T. et al. 2015. Microbial ecology of hot desert edaphic systems. FEMS Microbiology Reviews, 39, 203-221. https://doi.org/10.1093/femsre/fuu011 Manzoni, S. et al. 2012. Responses of soil microbial communities to water stress: results from a meta-analysis. Ecology, 93(4), 930-938. https://doi.org/10.1890/11-0026.1 Prosser, J. 2015. Dispersing misconceptions and identifying opportunities for the use of ‘omics’ in soil microbial ecology. Nature Reviews Microbiology 13, 439-446. https://doi.org/10.1038/nrmicro3468 Schimel, J.P. 2018. Life in dry soils: Effects of drought on soil microbial communities and processes. Annu. Rev. Ecol. Evol. Syst., 49, 409-432. https://doi.org/10.1146/annurev-ecolsys-110617-062614 Schloter, M. et al. 2018. Microbial indicators for soil quality. Biol Fertil Soils, 54, 1-10. https://doi.org/10.1007/s00374-017-1248-3 Tecon, R. & D. Or. 2017. Biophysical processes supporting the diversity of microbial life in soil. FEMS Microbiology Reviews, 41, 599-623. DOI: 10.1093/femsre/fux039
0 Comments
 The next 9 blog posts will summarize my reading assignments for the EBIO 3rd semester exam. The exam is scheduled for 3 hours and involves my four committee members asking me questions about anything at all! I was required to put together a reading list covering 4 main topics: biological soil crusts & drylands, microbial ecology, ecosystem services, and community, restoration, and disturbance-succession ecology. Obviously, I actually have 7 topics, which I managed to squeeze into "4". The reading list is a guide for the exam. To help me through this exam preparation process, I will use these blogs to summarize what I am learning over the next 9 weeks.
My readings this week were fun! We are now in the microbial ecology section of the Reading List. I probably spent more time reading papers linked to the ones on my list than I should have, but I assume that exploring additional works is part of the process. My advisor for this section said I should develop a good understanding of microbiology and soil microbial ecology which includes reviewing nutrient cycles and dominant soil taxa (who they are and what they do). I should also understand the limitations of this knowledge. There are several layers to these questions. First, broadly understanding the most common soil microorganisms. Second, drylands are likely different from the global average, so I should know how arid places are different. Third, I should understand how biological soil crusts are different from a typical desert soil. Starting with the broadest question, Janssen (2006) found in their survey of global soils (16S rRNA sequencing) that dominant phyla include Proteobacteria (40%), Acidobacteria (20%), Actinobacteria (12%), Verrucomicrobia (8%), with Bacteroidetes, Chloroflexi, Planctomycetes, Gemmatimonadetes, and Firmicutes making up the rest. In a different study also using 16S rRNA genes across many different biomes (Fierer et al. 2012), dominant taxa were similar. Archaea are relatively rare in soils. The Fierer paper notes that Cyanobacteria and Archaea increase in desert soils. Maestre et al. (2015) note that for global aridlands, the dominant bacterial phyla are Actinobacteria, Proteobacteria, Acidobacteria, Planctomycetes. As you increase in aridity, Chloroflexi and alpha-Proteobacteria increase while Acidobacteria and Verrumicrobia decline. For fungi, Basidomycota dominate (~56%) globally, but in aridlands, Ascomycota dominate (the Basidiomycota decline to ~22%). In biological soil crusts in particular, we see higher abundances of Acidobacteria, Chloroflexi, Planctomycetes, and Verrumicrobia (Maier et al. 2018). Findings from various papers seem to align fairly well. There are particular phyla that respond well to increasing stress associated with higher temperatures and decreasing water availability. Those who have adaptations to survive aridity are the ones we find in drylands. If you are a lucky microbe and are able to find a biocrust to live in, you may be able to thrive in those harsh conditions that otherwise would limit your growth (I am thinking here about the Acidobacteria). My next tasks is to delve into review papers about these phyla to learn their broad functions or physiology. The papers this week also included quite a lot on nitrogen, so I took some time reviewing the nitrogen cycle. In particular, in drylands, people research HONO gas production which contributes to hydroxyl radical formation and the production of tropospheric ozone. NO gas production is also important for its role in acid rain and stratospheric ozone depletion. Many of the microbial ecology papers are also concerned with nitrification (ammonium -> nitrite -> nitrate), denitrification (nitrate to stable nitrogen gas), and nitrogen fixation, which are all microbially mediated processes. I've been thinking through these processes in relation to last week's reading about nitrogen deposition being one of the main drivers of change in global drylands. My reading included one paper on best practices for microbiome research (Knight et al. 2018), an overview of how aridity impacts soil microbial diversity and abundance (Maestre et al. 2015), two papers specific to biological soil crusts (Garcia-Pichel et al. 2013 & Maier et al. 2018), two papers on statistical methods of analyzing microbial data (Blagodatskaya et al. 2013 & Faust et al. 2018), and one paper on how microbial communities maintain stability in spite of climate change (de Vries et al. 2013). I have read the Knight paper before for my recent metagenomics class with Dr. Fierer. In general, the paper advocates for using exact sequence variants instead of OTUs (which are groups of sequences with 97% similarity) which were traditionally used in the field. The paper also advocates for using metagenomic approaches instead of marker gene sequencing (the technique that I will be using) when possible since you can more information from the data. They also offer advice for dealing with compositional data which we commonly discussed in our class as being a major challenge for microbiome data (it must be treated differently from a statistical perspective). Since I am doing a marker gene analysis, the paper warns of 4 sources of bias in this approach: 1) primers do not have equal affinity for all taxa, 2) there is bias in selection of the variable region you are going to target, 3) amplicon size, 4) the number of PCR cycles. In addition, you are often limited to genus-level taxonomic resolution. As practice for describing a complete microbiome study with marker genes...you would design an experiment with the proper replication and controls. You would then take soil samples in a sterile way, homogenize the material, and when possible store the samples at -80C. You then need to extract DNA using a standard method. At this point you can use spike ins or perhaps deal with relic DNA if necessary. One DNA is extracted, you have to amplify the marker genes of interest with a known sequence tag so that you can identify the sample that it came from. You then pool all the samples together and have the DNA sequenced. For data analysis, you separate taxa into groups by their sample tags, remove the tags and primer sequences, and then group sequences into exact sequence variants. You would then align the sequences to some database (Greengenes or SILVA) which will tell you the taxonomy of the sequence. Some common analyses that you might try would be to count the number of taxa identified in each sample (richness) and then determine any similarities or differences in the community as a whole using ordination or differential abundance tests. If interested, one might use qPCR to determine the absolute abundance of genes in each sample and pair this to the relative abundance data described above. You could also include metadata or 'omics data. With these, you would try traditional correlation methods with Mantel statistical tests, networks, or regressions. Paper 2 discussed aridity and soil microorganisms. The most powerful part of this paper was their use of structural equation models (SEM) to determine that plant cover, soil pH, and organic carbon content together strongly affect the diversity and abundance of soil microorganisms with increasing aridity. They determine, most importantly, that aridity negatively affect soil carbon content and that soil organisms are carbon limited. Once water is available, organisms that are able to quickly regain activity and make use of available carbon do well. The authors make some predictions about the negative relationship they also found between the diurnal temperature range and bacterial/fungal abundances. The predict that large daily temperature swings cause increased physiological stress, which result in negative effects on plant cover which causes reduced carbon inputs into soil. They have some uncertainties associated with this prediction because other research has shown that plants increase their water use efficiency as carbon dioxide levels increase. This may mitigate any impacts due to aridity and result in stable microbial communities (though a second paper refutes this). The two papers on biological soil crusts were badass. The first was written in 2013 by the king of molecular approaches to biocrusts, Ferran Garcia-Pichel. In this work, the authors assess continental scale trends in biocrusts based on 16S rRNA diversity related to soil type, geochemistry, soil texture, and climate. At high taxonomic levels, there were no differences across the continent. But because a lot of prior work has been done for the Cyanobacteria, they were able to dig into cyanos specifically. They show that cold deserts are dominated in Microcoleus vaginatus. Hot deserts shift to Microcoleus steenstrupii. Using ordination and regression, they show that this trend is correlated to temperature (and not precipitation or geochemical factors which are important drivers for vegetation and moss). These two Microcoleus taxa are not closely related. They both are filamentous, non-heterocystous and they both produce rope-like cellular forms (a convergent trait). They follow up with physiological testing to show that all strains survived freezing, M. vaginatus could not survive hot temperatures, M. steenstrupii could survive at high temperatures. The authors then predict based on current climate change models that there will be complete replacement in 50 years to M. steenstrupii (no dispersal limitation is expected). The second biocrust paper focused on photoautotrophs in biocrusts asking whether there are heterotrophic organisms change as succession progresses. We know that the photoautorophs shift from bare soil to cyanobacteria to lichens or mosses, but what about the non-photosynthetic component? The answer is yes with a corresponding change in some functions. For instance, HONO and NO are produced at high levels in cyanobacteria crusts but not in the lichen or moss crusts. Carbon and nitrogen are higher in biocrusted soils, diversity is higher, and pigment production is higher. The most surprising finding for me was that there were a minimum of 5000 ASVs in bare dryland soils and up to 11000 in biocrusted soils. This is a huge number to have to deal with statistically, so I see why the authors chose ordination to show the differences between bare soils and those with biocrusts of different successional stages. The two statistical papers were more challenging. Faust et al. 2018 dealt with time series data in microbial studies with an emphasis on 4 different types of noise and how you could use the noise profiles to filter data to a more manageable size. The other paper, Blagodatskaya & Shade (2013) dealt with measuring the active microorganisms instead of the total microbial pool, which might include dormant and potentially active organisms. For me, this is less important because I assume all of my organisms are dormant for most of the year with periodic activity during rainfall events. This would be important to think about if I were to bring biocrusts into the greenhouse to work on microbial function. It is important to keep in mind that in soil generally, only about 2% of the total are active microbes, 40% are potentially active, and the rest are dormant. Some random facts to remember from this paper include: 1) oligonucleotide probes can bind to soil organic matter, 2) you can use FISH on a polyethylene terephtalate film buried in soil to do microbial imaging, 3) generally there is low RNA yield and poor protein extraction from soils, 4) ATP is decomposed within several hours after its release into the soil, 5) PLFA content is twice as large in G(-) cells compared to G(+) cells, 6) microbial cells in soil are smaller than in pure culture, 7) microbes can be active and "starving", 8) changes between the 4 physiological states of microbes in soil are common due to the spatial and temporal variability of substrates, 9) a shift to active state follows the sequence: respiration increase, ATP and enzyme production, DNA/RNA/PLFA synthesis, and growth. People usually study the growth phase. The final paper this week was about controls on microbial community stability. Stability is the ability to resist and recover from disturbances and it depends on 1) your functional traits, 2) your life-history strategy, 3) the soil environment. This paper predicts that you can use life history strategies to determine how a microbial community will respond to disturbance. An r-strategy is to have a high growth rate and low resource use efficiency. A k-strategy is to have a low growth rate with a high resource use efficiency. K-strategists are likely less resilient to disturbance, but also more resistant. In addition, the authors show how higher trophic levels can affect resilience of a microbial community through preferential grazing and dispersal, how plant presence will increase the resilience of the community, and how moisture availability increases resilience. Some things to think about are adaptation, how a series of disturbances may change the response, the role of evolutionary changes vs. community structure, and the role of routine successional trajectories (like seasonality). See you next time for another microbial ecology post. References Blagodatskaya, E. & Kuzyakov, Y. 2013. Active microorganisms in soil: Critical review of estimation criteria and approaches. Soil Biology & Biochemistry 67, 192-211. https://doi.org/10.1016/j.soilbio.2013.08.024 de Vries, F. & A. Shade. 2013. Controls on soil microbial community stability under climate change. Frontiers in Microbiology, 4(265). https://doi.org/10.3389/fmicb.2013.00265 Faust, K. et al. 2018. Signatures of ecological processes in microbial community time series. Microbiome 6:120. https://doi.org/10.1186/s40168-018-0496-2 Fierer, N. et al. 2012. Cross-biome metagenomic analyses of soil microbial communities and their functional attributes. PNAS 109(52), 21390-21395. www.pnas.org/cgi/doi/10.1073/pnas.1215210110 Garcia-Pichel, F. et al. 2013. Temperature drives the continental-scale distribution of key microbes in topsoil communities. Science 340, 1574-1577. DOI: 10.1126/science.1236404 Janssen, P.H. 2006. Identifying the dominant soil bacterial taxa in libraries of 16S rRNA and 16S rRNA genes. Applied and Environmental Microbiology 72(3), 1719-1728. Knight, R. et al. 2018. Best practices for analysing microbiomes. Nature Rev Micro. https://doi.org/10.1038/s41579-018-0029-9 Maestre, F. et al. 2015. Increasing aridity reduces soil microbial diversity and abundance in global drylands. PNAS 112(51), 15684-15689. https://doi.org/10.1073/pnas.1516684112 Maier, S. et al. 2018. Photoautotrophic organisms control microbial abundance, diversity, and physiology in different types of biological soil crusts. The ISME Journal 12, 1032-1046. https://doi.org/10.1038/s41396-018-0062-8  The next 9 blog posts will summarize my reading assignments for the EBIO 3rd semester exam. The exam is scheduled for 3 hours and involves my four committee members asking me questions about anything at all! I was required to put together a reading list covering 4 main topics: biological soil crusts & drylands, microbial ecology, ecosystem services, and community, restoration, and disturbance-succession ecology. Obviously, I actually have 7 topics, which I managed to squeeze into "4". The reading list is a guide for the exam. To help me through this exam preparation process, I will use these blogs to summarize what I am learning over the next 9 weeks.
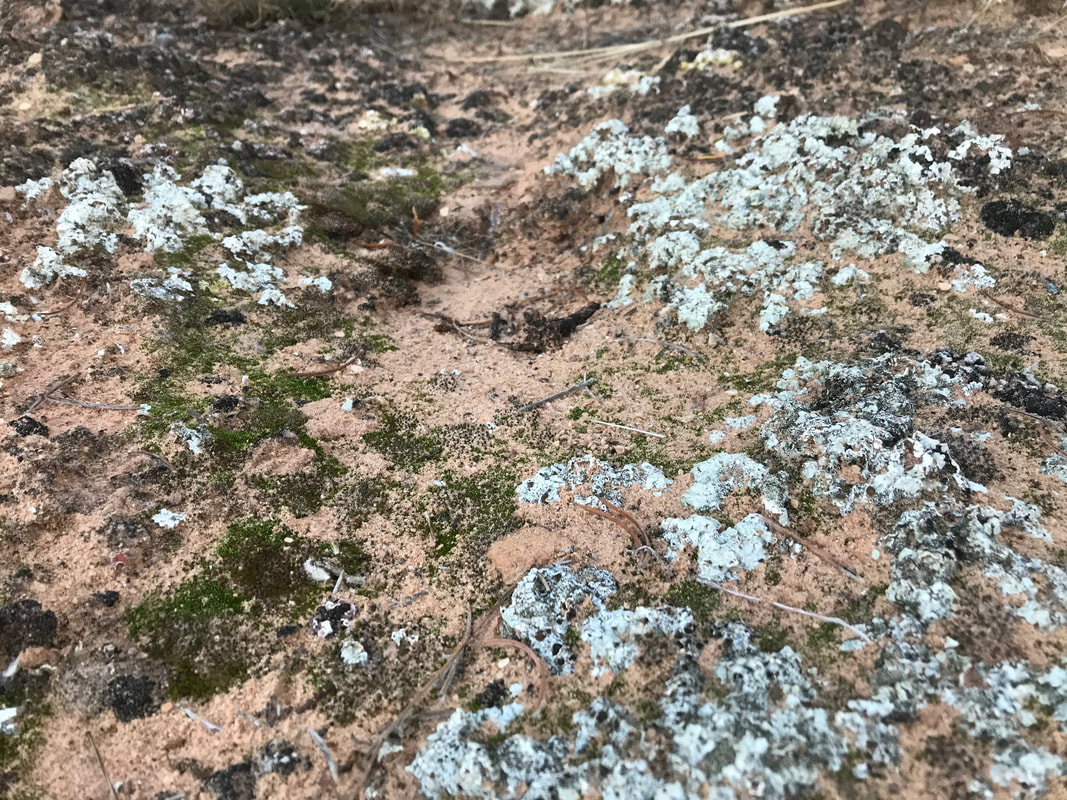
This week my reading included two papers on drylands/desertification and three papers on biocrusts. The Maestre et al. (2016) paper was a fantastic review and a good example of why my professors have been encouraging me to read lots of reviews at this stage. This paper discusses 4 important global change drivers in drylands (climate change, grazing, land cover change (woody encroachment), and nitrogen deposition) to explain how drylands may change in the future. This paper also offers an alternative perspective on dryland classification. The Aridity Index is a better way to classify drylands because it takes into account both mean annual precipitation (as discussed in blog #1) and mean potential evapotranspiration. Drylands have an index less than 0.65. Delving into the four drivers of change, let's first think about climate change. There are four expected climatic changes for drylands: higher temps (~+4C), shifts in seasonal rainfall, greater frequency of extreme events like drought or heatwaves, and increased aridity. Research has shown that with drought, there are alterations in plant forms, interactions, and cover. Increasing temperatures result in declines in multifunctionality. Increasing aridity is associated with reduced soil organic matter and total nitrogen. Increasing aridity can imbalance soil nutrient stoichiometry. Drylands are home to different below-ground microbial communities than other climates with Actinobacteria (bacteria) and Ascomycota (fungi) dominating the communities. We do not know much about how these communities respond to increasing aridity (or at least this was not discussed in this review). The second driver of change in drylands is nitrogen deposition. My biggest question after reading this section is where nitrogen is predominantly coming from in dryland systems? Regardless, the main idea is that increased nitrogen results in reduced native plant diversity, changes in plant species composition, soil acidification, increased aluminum toxicity, and altered nitrogen cycling. The third driver is intensified livestock grazing which is associated with less soil carbon, less soil stability, less nutrient cycling, and less water infiltration. The final driver is woody encroachment and the authors did their own analysis of how plant traits and aridity result in different ecosystem function. There is an entire section of the paper about the relative importance of these 4 drivers and two applications of this information (for desertification and restoration). My favorite ideas in the Maestre et al. paper are in thinking about why cyanobacteria are interesting and warrant further study. They are highly motile and have the ability to be the first colonizers after disturbance, they are powerful soil stabilizers, and we know that cool-adapted species are replaced by warm-adapted organisms as you move across climatic gradients. For these reasons, the authors suggest that cyanobacteria could be indicators of global change, something you might measure in addition to all the other plant and microbial and soil measurements to tell you that the environment may be shifting (or that restoration may be needed). The perspectives presented in Maestre et al. (2016) were understood in 1990 when Schlesinger published Biological Feedbacks in Global Desertification. This paper also tries to integrate climate change, grazing, and land cover change into a single story for explaining their observations of woody encroachment and desertification at the Jornada Experimental Range in New Mexico. Their idea was that any increase in the heterogeneity of resources across a dryland landscape may result in positive feedbacks that drive desertification. The general story goes like this: as you increase grazing intensity on a landscape, there is a decline in grass cover and reduced competitive potential of grasses compared to other vegetation. Trampling by the grazers compacts the soil, which results in lower infiltration rates, greater runoff, and more erosion (nutrients leach away). Shrubs maintain soil moisture compared to non-vegetated surfaces and so effective infiltration occurs mostly under the shrubs. Nutrient cycling is confined to under shrubs as well. This creates "islands of fertility" or perhaps just remnant fertile homogeneous soil areas. Feedback in this system has to do with water; transpiration is reduced in shrublands compared to grasslands, so temperatures actually increase with woody encroachment through lower humidity and precipitation. These hot dry soils have slower nitrogen accumulation which feeds back to promote shrubs whose growth is less tightly tied to nitrogen turnover in the soil. I am not sure that this narrative continues to hold value or that it is broadly applicable to many systems. I'd have to read a review article (like Maestre) to understand if these ideas are still held. But this paper has a lot of value in reminding me of the importance of biogeochemistry... I dug into nitrogen cycling once again and remembered the pathways of nitrogen fixation, denitrification, and ammonia volatilization. Microbes control these processes in the soil! For the three biocrust papers, one was specific to the CO Plateau (Zelikova et al.), one provided a broad overview of different metrics you could use to measure the "health" of a biocrust (Mallen-Cooper et al.), and one was a fantastic comparison of climate manipulations and physical disturbance on biocrust communities over long time periods (Ferrenberg et al). The key pieces of information from Zelikova's experiment are that after 2 years of warming biocrusts (+2C), there were no changes to a wide variety of metrics. But after increasing the frequency of summer precipitation events for two years, there were significant moss die-offs. For me, this paper is important because it reminds me that pigment concentrations that we frequently measure vary seasonally as do the percent organic matter and the total nitrogen of the soil. It also help set the stage for what people in my field predict or already know about dryland ecosystem response to climate change...the common questions that are being asked and hypotheses. The paper about functional metrics for biocrusts was important to read because it organizes 22 functional indicators into 5 broad groups. As I develop biocrust studies, I can draw one or more metric from each category to have a more well-rounded analysis of biocrust recovery. The 5 categories are erosion resistance, nutrient accumulation, productivity, energy balance, hydrology. I think there are 2 important concepts from the paper. The first is that most of the measurements we can do are destructive. You have to sample and remove biocrust in order to see how it is doing. The authors argue for a global trait database so that as a field we move away from destructive methods. The second key idea is that there are multiple ways to estimate the reference condition or the potential function for biocrusts. You don't always need an intact reference to compare to, you can also use expert opinion, spatial methods, and literature reviews. This is important because most of the landscapes we work in are altered (100+ years of grazing pressure and now climatic change), therefore, reference sites are hard to come by. For now, we do have the Canyonlands National Park nearby with excellent mature, intact biocrust communities that we regularly rely on as reference material. The final biocrust paper was really cool. In this one, they applied climate manipulations to biocrust communities for 10 years (warming and watering). In just one year, they observed changes for watering treatments. It took 6 years for them to see changes in the warming treatments. Similar to Zelikova et al. , mosses decline, lichen are variable, and cyanobacteria fill the gaps where other functional groups decline. When they compared these findings to 15 years of biocrust trampling data (a physical disturbance instead of climatic), they saw that trampling was much worse for lichens. In theory, these transitions to earlier successional states (cyanobacteria instead of lichens or mosses) should be linked to functional shifts as well since people have observed differences between early and late succession biocrust communities in their ability to fix C and N, their vulnerability to leaching nutrients, their erosiveness, dust production, and water infiltration rates. Early successional biocrusts are known to have lower soil stabilities, less fertility, and less carbon storage. The authors seemed hopeful that because community changes due to climate are relatively slow (6 years or more) there may be potential for long term adaptation and species shifts. References Biological Soil Crusts: An Organizing Principle in Drylands. Weber, B., Budel, B., Belnap, J. 2016. Ferrenberg, S. et al. 2015. Climate change and physical disturbance cause similar community shifts in biological soil crusts. PNAS 112(39), 12116-12121. https://doi.org/10.1073/pnas.1509150112 Maestre, F. et al. 2016. Structure and functioning of dryland ecosystems in a changing world. Annu. Rev. Ecol. Evol. Syst. 47, 215-237. https://doi.org/10.1146/annurev-ecolsys-121415-032311 Mallen-Cooper, M. et al. 2020. A practical guide to measuring functional indicators and traits in biocrusts. Restoration Ecology 28, S56-S66. https://doi.org/10.1111/rec.12974 Reed, S.C. et al. 2019. Biocrust science and global change. New Phytologist 223, 1047-1051. https://doi.org/10.1111/nph.15992 Schlesinger, W.H. et al. 1990. Biological Feedbacks in Global Desertification. Science 247, 1043- 1048. DOI 10.1126/science.247.4946.1043 Zelikova, T.J. et al. 2012. Warming and increased precipitation frequency on the Colorado Plateau: implications for biological soil crusts and soil processes. Plant Soil 355, 265-282. DOI 10.1007/s11104-011-1097-z 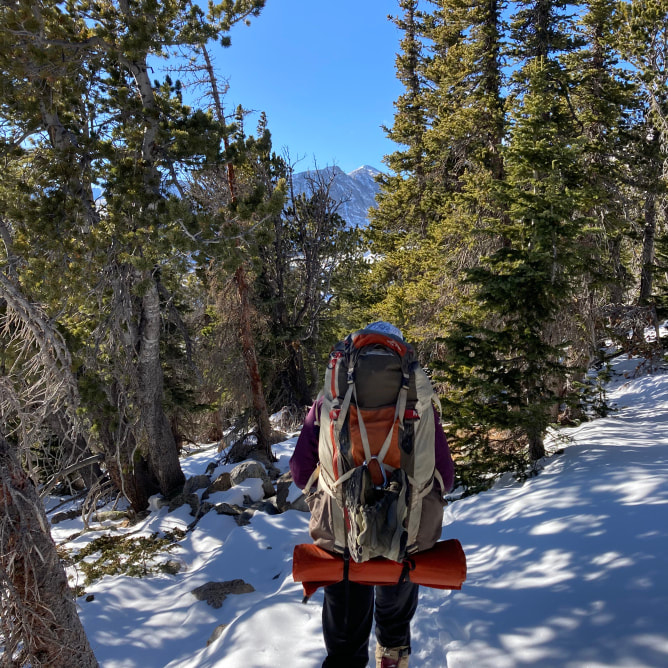 Me starting a winter trek to the tall snowy mountain The next 9 blog posts will summarize my reading assignments for the EBIO 3rd semester exam. The exam is scheduled for 3 hours and involves my four committee members asking me questions about anything at all! I was required to put together a reading list covering 4 main topics: biological soil crusts & drylands, microbial ecology, ecosystem services, and community, restoration, and disturbance-succession ecology. Obviously, I actually have 7 topics, which I managed to squeeze into "4". The reading list is a guide for the exam. To help me through this exam preparation process, I will use these blogs to summarize what I am learning over the next 9 weeks.
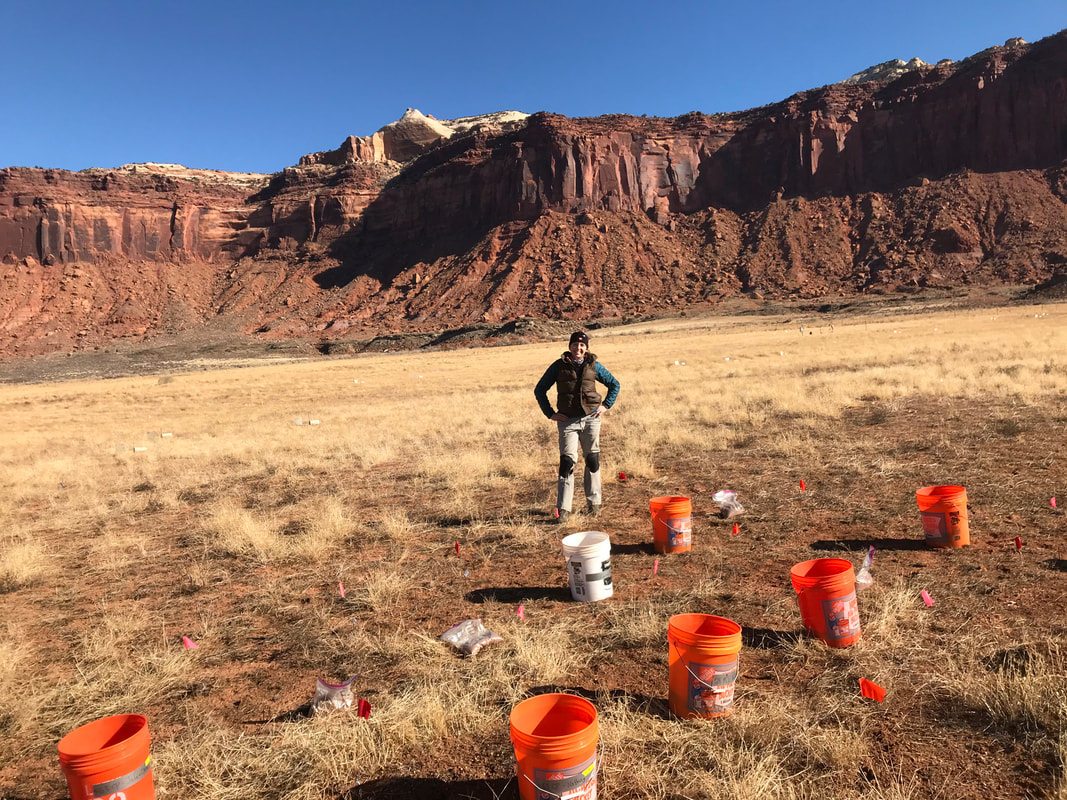
The first two weeks of my reading are focused on literature of global drylands and biological soil crusts, a familiar domain. Drylands are categorized into four groups depending on their annual precipitation levels and other climatic factors: hyper-arid (<25 mm), arid (25-250 mm), semiarid (250-500 mm), and dry sub-humid. For readers in Wyoming and Colorado, the average annual precipitation of Boulder, CO is 526 mm, or dry sub-humid. In Cody, WY it is 267 mm, so it is semi-arid. The area where I work in Utah receives 219 mm (semi-arid). The driest location in the U.S. is Death Valley, with 60 mm annually, making it arid. The driest location in the world is the Atacama Desert of Chile which receives 15 mm annual precipitation, making it hyper-arid. The Earth’s poles are also very dry. About 45% of the Earth’s terrestrial area is dryland. And about 40% of the world’s population lives in and relies on drylands. Drylands are vulnerable to degradation due to limited water availability. There are a limited number of days each year with enough water availability for plants (and other organisms) to grow and do other life processes, so growth/recovery after disturbance can be quite slow compared to places with more water. One of my favorite ideas from my reading this week was presented in Bowker et al. (2007). For drylands in a degraded state, physical processes rather than biotic processes dominate. I can really feel this idea when I stand out in the field we are trying to restore in Utah. There is so much bare ground and so much erosion occurring that is important for us to overcome physical barriers (erosion) so that biotic processes (vegetation growth) can get going. Desertification is a term used to describe degradation in drylands. The term is broadly used, so estimates of desertification range from 4-74% globally. A definition from Bestelmeyer et al. (2015) is that desertification is an “undesirable state change in drylands” or “persistent and severe reductions in biological productivity due to unsustainable land uses, such as poverty and migration”. My advisor, Nichole Barger, is currently part of the UN Convention to Combat Desertification (UNCCD) due to desertification being a widespread problem that threatens human health and well-being in many places. The UNCCD was established to “assist countries to implement the Convention and address desertification, land degradation and drought”. Their main initiatives include Land Degradation Neutrality, the Great Green Wall, and the Drought Initiative. Our lab’s research does not directly engage with UNCCD efforts, but I think it is important to recognize that the research we do is applicable to more than just the site in Utah where we work. Any progress we make toward restoration of drylands will benefit land restoration efforts around the globe. This is important because human population is expected to continue to grow, land use will increase or shift, and land degradation will continue while climate change is expected to result in altered rainfall, higher temperatures, more severe droughts, and more frequent extreme events in the coming years across global drylands. In other words, this restoration work has value today and in the future in many places around the world. So how do scientists know if a landscape is degraded? This is actually a challenging question because we have to first know what a “healthy” landscape looks like for a certain area. And there is not just one single healthy land state. For instance, one important ecological concept is succession. The community that lives on a landscape will change over time. For example, after fire, the Yellowstone ecosystem will move through a predictable succession of vegetation communities: bare rock; lichens, mosses; small annual plants; perennial grasses; grasses, shrubs, and small shade-tolerant trees; shade-tolerant trees. Lodge-pole pine trees dominate the climax community of that ecosystem. Just as there are multiple versions of “health”, there are also multiple levels of “degradation” for any given piece of land. Because of this complexity, people organize the different ecosystem states and the processes that move ecosystems from one state to another into State and Transition models. These are box and arrow diagrams, specific to a particular landscape, with narratives to describe as much as possible about the land condition. Sometimes it is fairly easy to know what will cause a landscape to shift and how much time it may take (like with succession after fire) because we have seen it before in similar ecosystems. Other times, it is very challenging to know what will cause a shift, what that landscape will look like, and what it may take to push the landscape back to a condition that is preferrable to people. For instance, the unpredictable effects of climate change or intensified land uses may have unknown states and transitions. In restoration ecology we worry about thresholds. These are state transitions that occur quickly and that may have no route back to a prior state. These are extremely challenging to rehabilitate and may result in land abandonment. I like the way Bestelmeyer et al. (2015) describes relationships between rangelands and croplands. In this paper, the authors incorporate human interests and pressures that result in particular state transitions into existing State and Transition Models, arguing that land-use is an important factor to include in these models. In their example, you can start by imagining a cropland, perhaps it is your favorite corn field. If the corn farmer is not very careful, soil erosion can lead to persistent changes in the soil profile (changes in soil texture, soil depth, water-holding capacity, or nutrient availability). These things start to constrain plant productivity, which limits recovery of soil quality. Year after year, these problems build up, resulting in the farmer noticing that her ears of corn are not as delicious or maybe her annual yield is slowly declining. After a while, the farmer decides that the cost of producing corn in this field is not worth the investment and so the cropland is abandoned and converted to rangeland. Erosion continues. You can imagine that the land may eventually become unsuitable for even rangeland use with limited forage available. At this point, it may be extremely challenging to rehabilitate the landscape to any of its prior states. Knowledge of the states and transitions for landscapes is important, as described above, if you want to be able to ensure sustainable land use. One paper I read described how biocrusts have been missing from dryland state and transition models. This is a major problem because as the authors see it, biological soil crusts cover a huge area in drylands and have very important ecosystem functions. A loss in biocrusts, can trigger a state transition across a threshold. So from a restoration perspective (preventing or reducing an undesireable state transition), Bowker et al. (2007) outline three key barriers to overcome in biocrust rehabilitation from less challenging to more challenging: propagule limitation, resource deficiencies, and active soil erosion. Bowker et al. also give us a definition of ecological restoration as defined by the Society for Ecological Restoration, “assisted recovery of a degraded, damaged, or destroyed ecosystem and attempts to return an ecosystem to its historic trajectory”. In restoration there are many different benchmarks that one may want to consider as targets for the restoration like composition, structure, pattern, heterogeneity, function, dynamics, and resilience. For example, when I delve into the microbial ecology of biocrust rehabilitation with my current research project using 16S rRNA gene sequencing, I will be able to understand composition (which microbes are present) better than we could with visual assessments. However, I have to combine samples across a plot and then mix them all together, so I lose information about structure, heterogeneity, and function by taking a sequencing approach. For those things, we would need to use other monitoring tools. And of course, we need that baseline or reference condition to compare our results to. Bowker et al. provides an overarching framework of 18 different dryland ecosystem variables that one could measure which are vital to the ecosystem: perennial species richness, annual species richness, total plant cover, aboveground phytomass, beta diversity, life form spectrum, keystone species, microbial biomass, soil biota diversity, biomass productivity, soil organic matter, maximum available soil water reserves, coefficient of rainfall efficiency, rain use efficiency, length of water availability, nitrogen use efficiency, microsymbiont effectiveness, cycling indices. These are not specific to biocrusts, but you could address at least 11 of these variables with a biocrust project. These could be useful as people plan ways to assess the outcomes of their rehabilitation efforts whether you are comparing the degraded site to a reference or just to itself over time. In Eldridge et al. (2020), the authors wanted to know the overall impact of biological soil crusts on water. They used a meta-analysis approach where you gather all of the papers that have ever been published on biocrusts and water quality or water delivery. They selected 7 water variables that had enough coverage in the literature and then they combined all of that information together. In this type of analysis, you can compare results across studies using a technique called a response ratio. In this case, they wanted to know how higher biocrust cover would affect each variable. So, for water infiltration, for example, you take the value that was measured for water infiltration at high biocrust cover and divide it by the value measured for water infiltration at low biocrust cover. You take the log of that value to get the response ratio. With this work, Eldridge et al. determined how biocrusts generally influence water and how that varies in different regions, with different soil textures, with different biocrust types, with different scales, and with various disturbances. The final paper this week was Antoninka et al. (2020) which is an example of biocrust rehabilitation research that directly addresses the 3 barriers described by Bower et al. in 2007. This project used a complex combination of different restoration techniques straw borders, three different soil stabilization tackifiers, surface roughening, inoculation, shading, and watering. In the end, they determined that active erosion was not important at their site, so any treatment they tried that would have improved soil erosion, did not have a huge impact on biocrust recovery. Instead, as shown in other projects, shading and inoculation worked the best. They also showed that soil texture matters for biocrust recovery (this is related to water availability). Like my own biocrust recovery project, the recovery of biocrusts using special treatments was in some cases slower than control plots. The site might have recovered on its own without human aid. References Antoninka, A. et al. 2020. Addressing barriers to improve biocrust colonization and establishment in dryland restoration. Restoration Ecology 28, S150-S159. https://doi.org/10.1111/rec.13052 Bestelmeyer, B.T. et al. 2015. Desertification, land use, and the transformation of global drylands. Front. Ecol. Environ. 13(1), 28-36. https://doi.org/10.1890/140162 Biological Soil Crusts: An Organizing Principle in Drylands. Weber, B., Budel, B., Belnap, J. 2016. Bowker, M.A. 2007. Biological soil crust rehabilitation in theory and practice: An underexploited opportunity. Restoration Ecology 15(1), 13-23. https://doi.org/10.1111/j.1526-100X.2006.00185.x Eldridge, D.J. et al. 2020. The pervasive and multifaceted influence of biocrusts on water in the world’s drylands. Global Change Biology, 6003-6014. https://doi.org/10.1111/gcb.15232 |
AuthorSierra is a graduate student in the Barger Lab at CU Boulder studying microbial ecology for dryland restoration. Archives
August 2023
Categories |
 RSS Feed
